Skip to content
Home 11.3 Spectroscopic identification of organic compounds
11.3 Spectroscopic identification of organic compounds
Degree of unsaturation or index of hydrogen deficiency (IHD)
- Used to determine number of rings or double bonds from a molecular formula
- Double bond = 1 IHD
- Triple bond = 2 IHD
- Ring = 1 IHD
- Aromatic = 4 IHD (3 double bond + 1 ring)
- For the generic formula CcHhNnOoXx:
- IHD = (0.5)(2c + 2 – h – x + n)
Electromagnetic Spectrum
- Various regions of EMS are basis of different types of spectroscopy
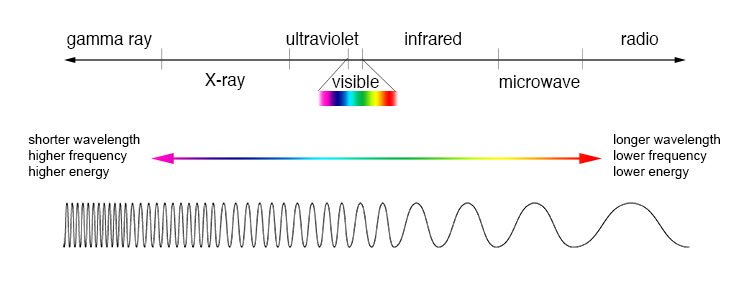
- X-Rays – Give information about bond distances and bond angles in a structure. Basis of X-ray crystallography
- Visible and UV light – Gives information about electronic energy levels and form basis of UV-vis spectroscopy
- Infrared Radiation – Provides information of functional groups present. Basis of IR spectroscopy
- Microwaves – Gives information of bond length
- Radiowaves – leads to information of connectivity of atoms and their chemical environments. Basis of Nuclear magnetic resonance (NMR)
Spectroscopy
- Infrared Spectroscopy
- Used in identifying functional groups. Basis of this is the spring model where every covalent bond is considered a spring. The frequency that these springs vibrate are called the wavenumber (1/λ)
- Identify each group by starting with the lowest peak, and working upwards
- Refer to Section 26 of Data booklet for wavenumber of different functional groups.
- 1H NMR Spectroscopy
- Gives information on different chemical environments of hydrogen atoms in a molecule. Basis is that nuclei of every H atom have two possible spin states and exist like magnets. The position of this spin relative to the standard spin (tetramethylsilane, TMS) is termed chemical shift
- Gives information on relative number of hydrogens per environment in a ratio. (Area under curve is number of hydrogens)
- Refer to Section 27 of Data booklet for chemical shift data
- Mass Spectroscopy
- Gives further information of functional groups When gaseous molecule is ionized, a molecular ion M+ is formed. The fragmentation pattern observed in a mass spectrum is each mass after a functional group is removed
- Refer to Section 28 of Data booklet for fragment data